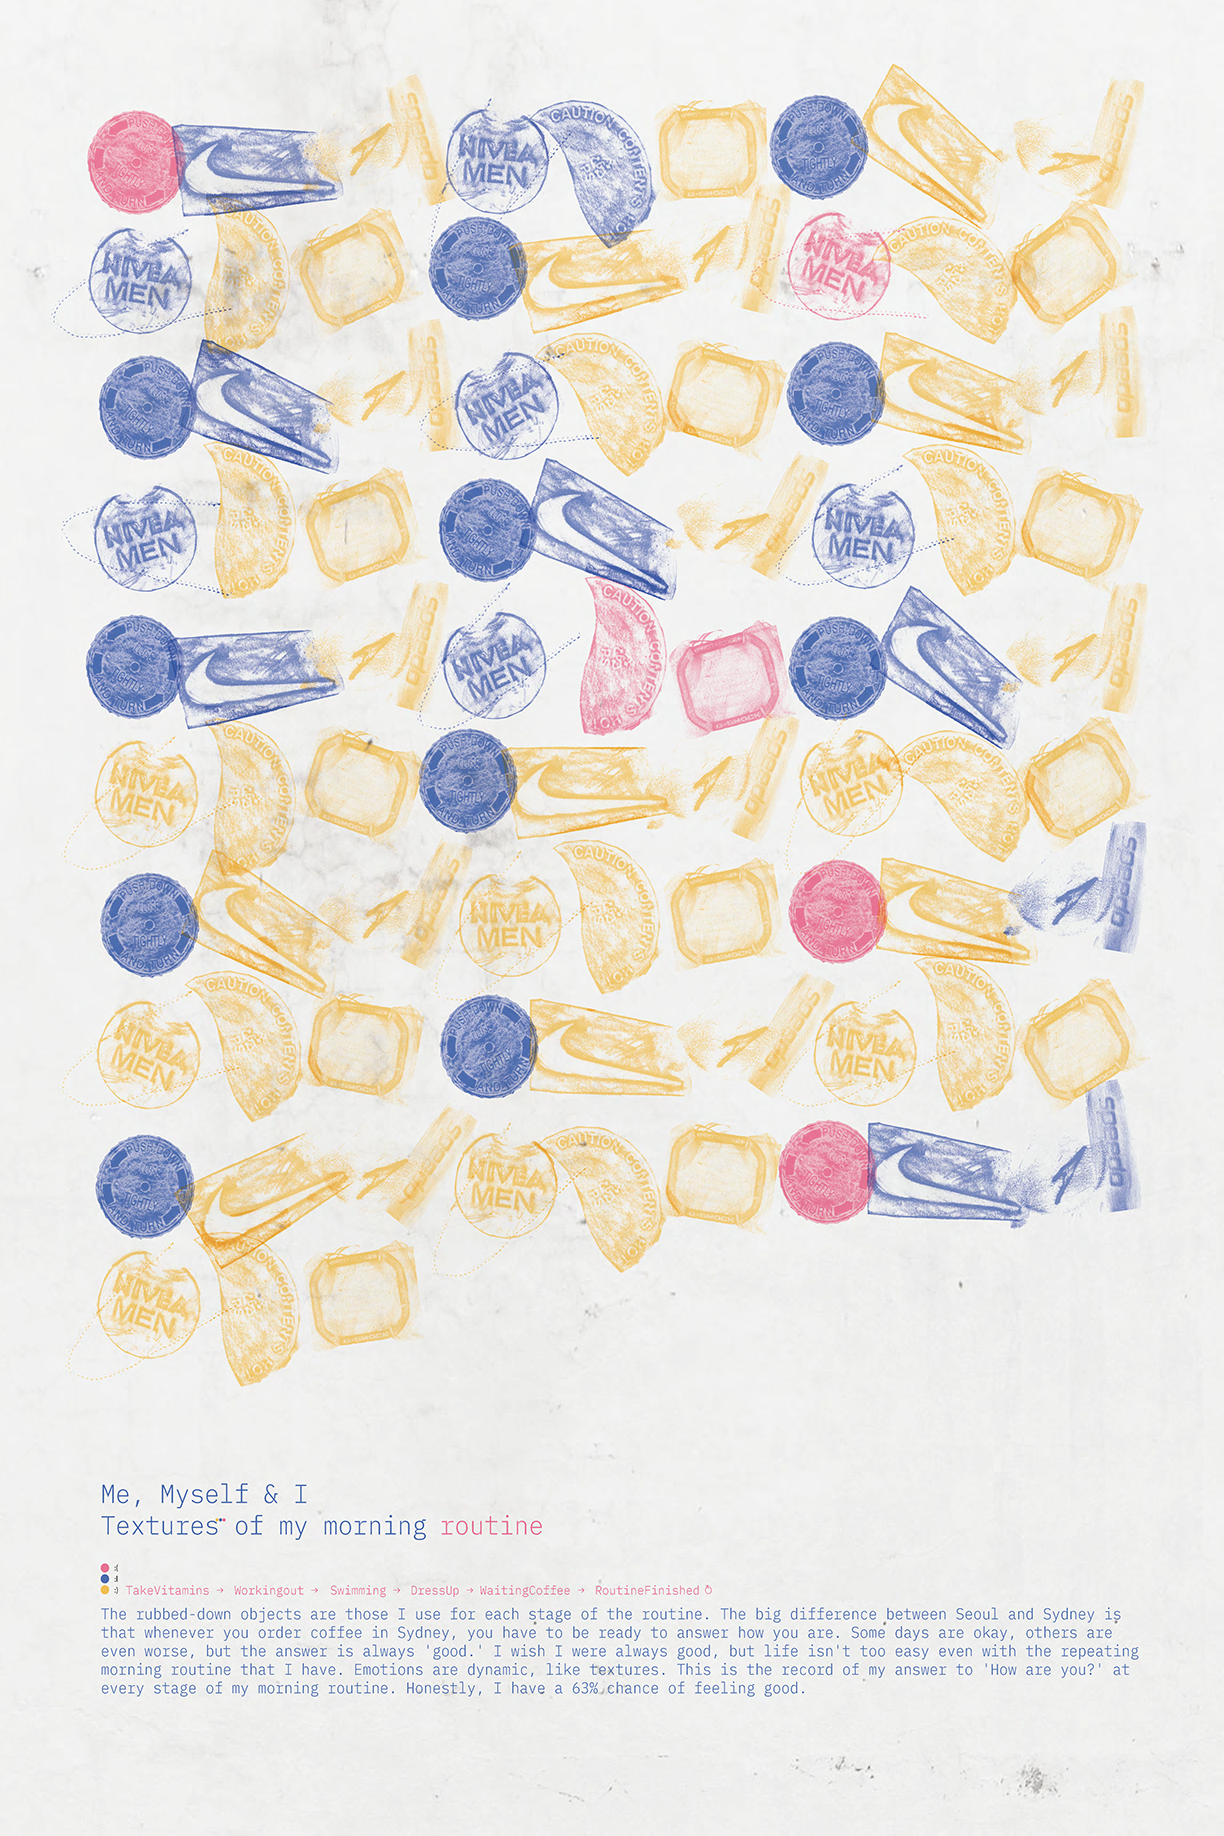
Challenge: Transform everyday morning routine data into an engaging infographic that resonates with creatives, while exploring unexpected ways to present statistical information through tactile visualization techniques.
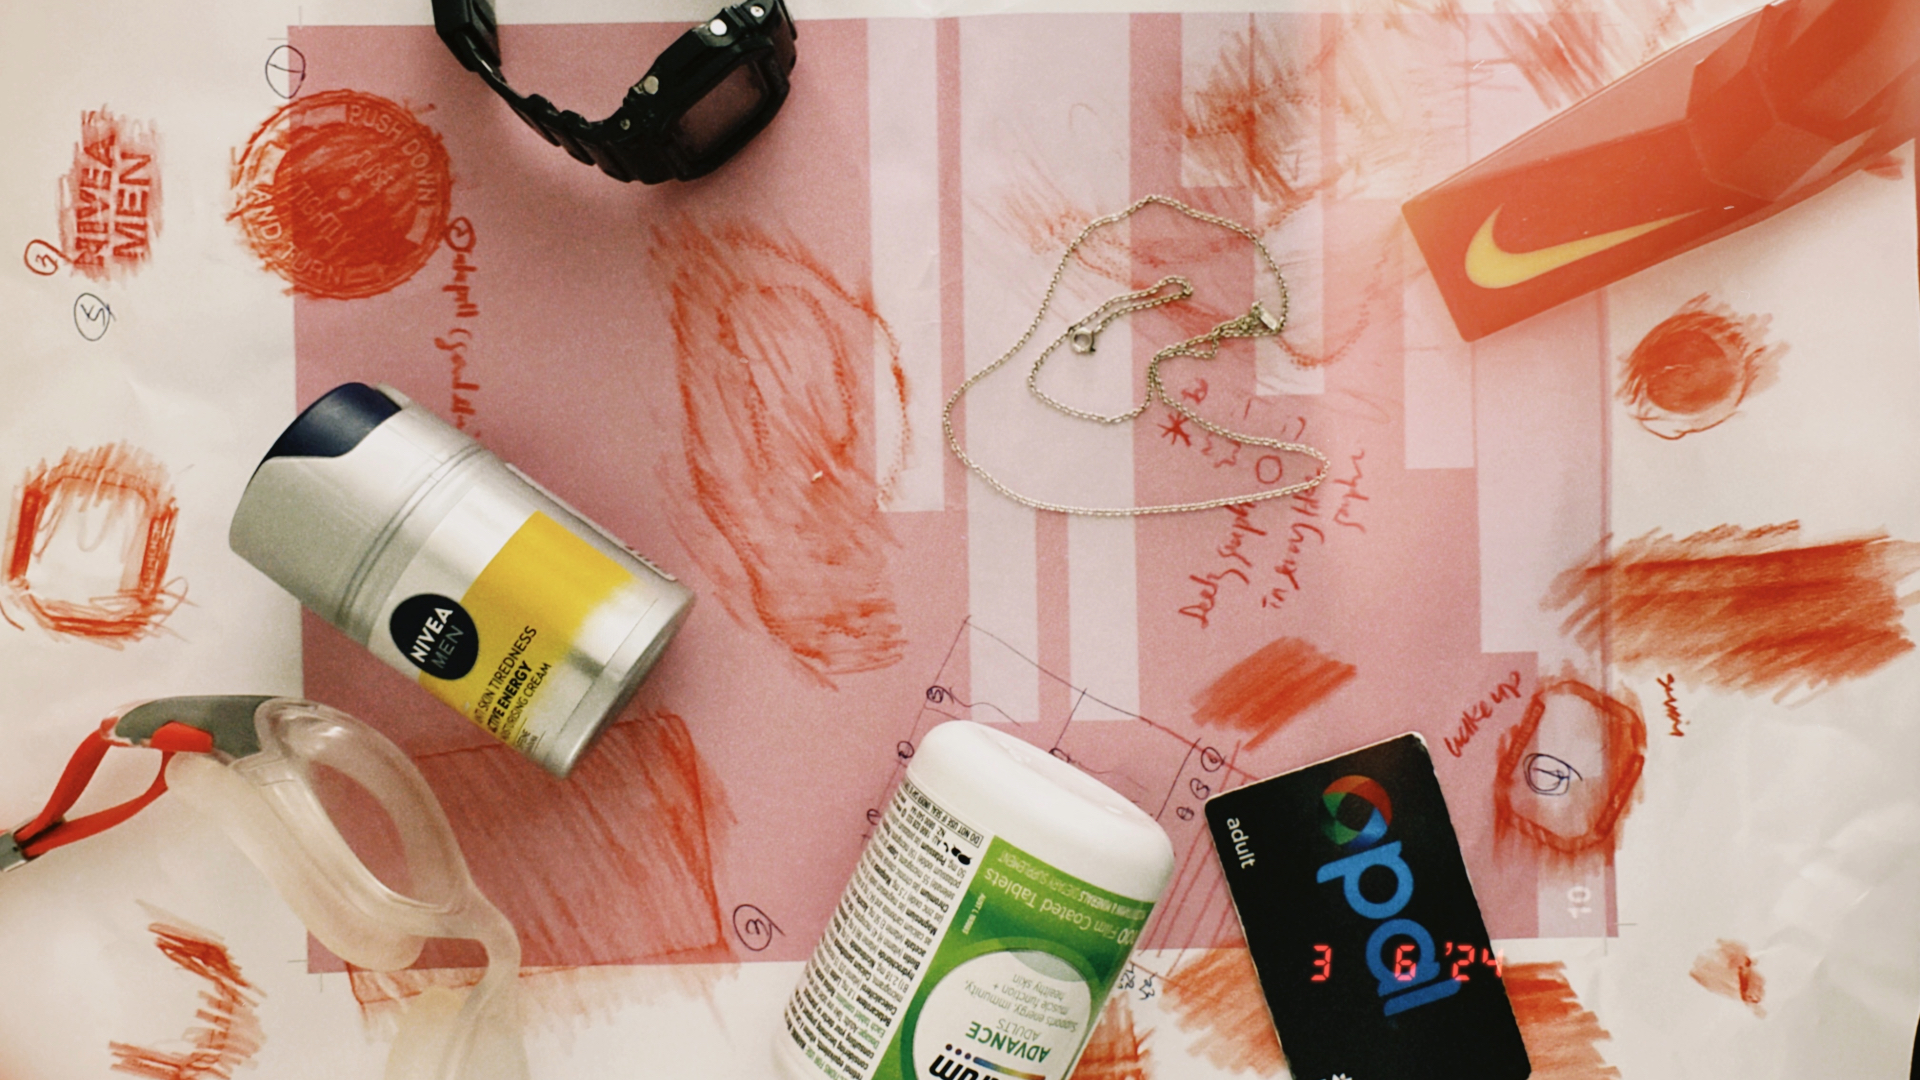
▲ Unifying visual language across objects
| Tools Used | Adobe Illustrator, Photoshop, Apple Shortcuts, Google Sheets |
| Fonts Used | IBM Plex Mono |
| Extra Info | This work is school project. Not Commissioned. |